devtools::install_github("USEPA/CompTox-ToxCast-tcpl")The ToxCast Data Analysis Pipeline
code
Ecotox
R
Test out tcpl package
Install the library:
Load the library with default settings:
library(tcpl)tcpl (v3.2.0.9000) loaded with the following settings:
TCPL_DB: NA
TCPL_USER: NA
TCPL_HOST: https://api-ccte.epa.gov/bioactivity
TCPL_DRVR: API
Default settings stored in tcpl config file. See ?tcplConf for more information.The code block runs without problems but the tcpPlot function generates a jpg or other formats of figure which is stored in the working directory. To render the file correctly, the generated figures are moved to the assets folder.
# Load all matching spids and then subset using the aeid desired to find m4id
mc5 <- tcplLoadData(lvl = 5,
                    fld = "spid",
                    val = "TP0000904H05",
                    type = "mc",
                    add.fld = FALSE) # 8 rows of data
m4id <- mc5[aeid == 714]$m4id # subset to 1 aeid extract m4id

# Default parameters used here: fld = "m4id", type = "mc" (type can never be "sc" when connected to API)
tcplPlot(val = m4id, output = "jpg", verbose = TRUE, flags = TRUE)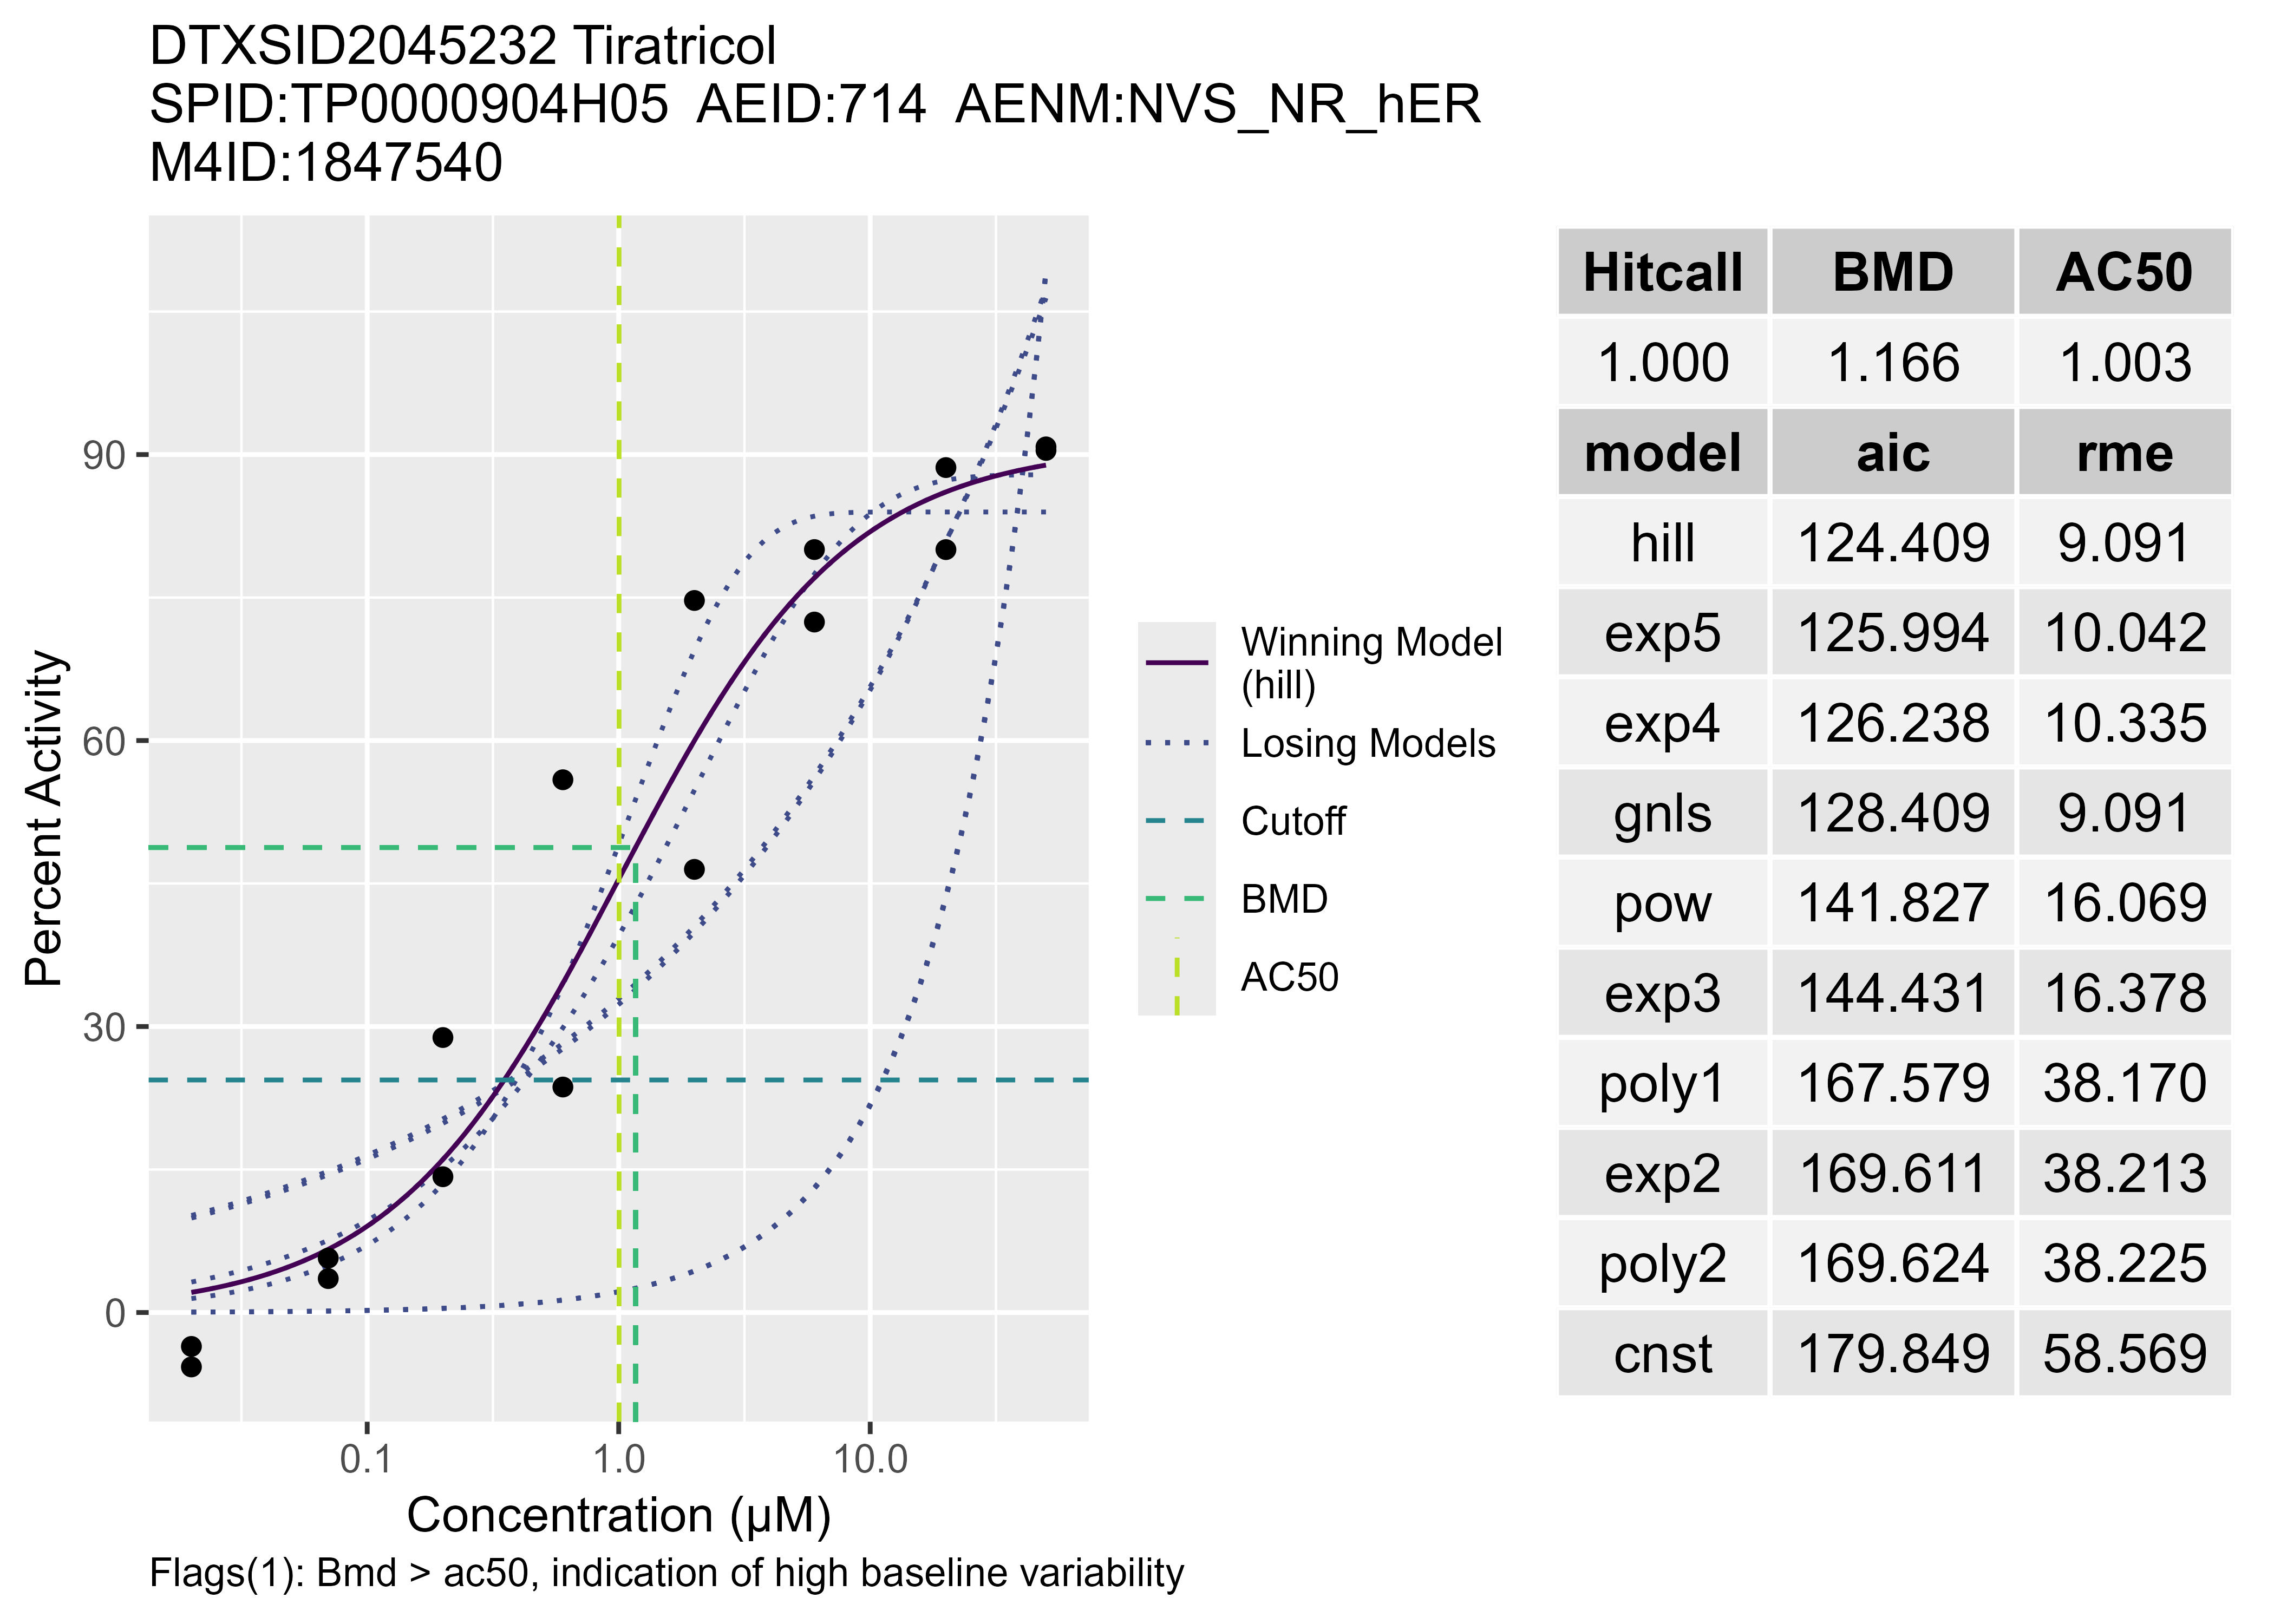
# Using the data pulled in the previous code chunk 'mc5'
m4id <- mc5$m4id # create m4id vector length == 8

# Default parameters used here: fld = "m4id", type = "mc" (type can never be "sc" when connected to API)
tcplPlot(val = m4id[1:4], compare.val = m4id[5:8], output = "pdf", verbose = TRUE, multi = TRUE,
         flags = TRUE, yuniform = TRUE, fileprefix = "API_plot_compare")